How to Read API Load Test Results
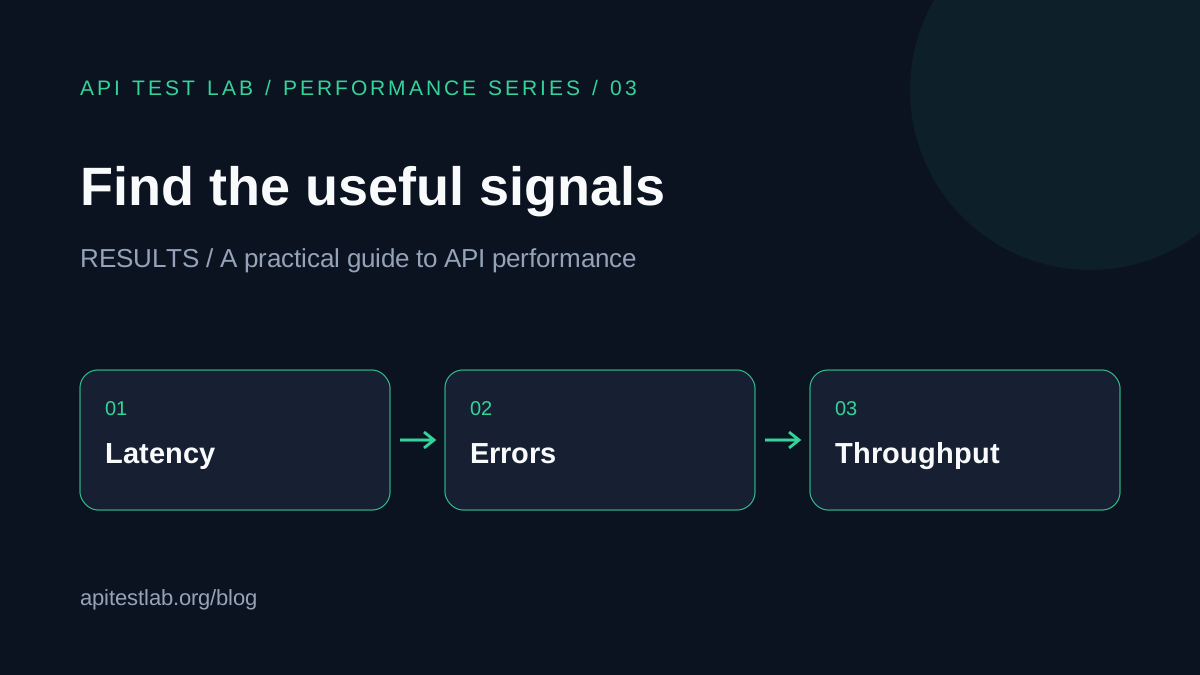
Read latency, throughput, failures, and server signals together to turn a test report into a useful diagnosis.
Part 3 of the API performance testing series. Read latency, throughput, failures, and server signals together to turn a test report into a useful diagnosis.
Begin with completed work
Before looking at response times, confirm the test performed the intended journey. Inspect achieved request rate, successful transactions, and failed requests. A fast response that skips the database or returns an error does not prove your application handled the workload.
Separate attempted requests from successful business operations. For a multi-step checkout, three successful HTTP requests might represent only one completed checkout.
Read latency as a distribution
The median describes the middle request; p95 and p99 describe the slower tail. Compare them together. A stable median and rising p99 may indicate a subset of requests waiting on a slow dependency or queue.
Do not average percentile values from separate workers and call the result a global percentile. Calculate across the combined observations or a compatible histogram. Use the existing latency percentile guide for the basics.
Group failures before investigating
| Failure group | Useful next check |
|---|---|
| Authorization failures | Test account permissions and token lifetime |
| Rate limit responses | Traffic policy and identity distribution |
| Server errors | Application logs and dependency failures |
| Timeouts | Queues, network path, and upstream duration |
| Failed body assertions | Response contract and business outcome |
Keep these groups separate. Authentication mistakes in test setup can dominate the report and hide the actual performance behavior. Review a small sample of failed responses without exposing credentials.
Find where throughput stops growing
Compare successive traffic steps. If attempted requests increase while successful throughput stays flat, identify what else changes at that moment. Database connection wait, worker saturation, CPU, or a growing dependency queue can help locate the constraint.
Correlation is a starting point, not proof. High CPU may be the consequence of retry storms rather than the original bottleneck. Use logs or traces to test a specific explanation.
Check the load generator too
The generator must have enough resources to deliver the workload. Inspect its achieved rate, CPU, connections, and network limits. Distinguish client-side waiting from server response time when the tool exposes those timings.
Include warm-up, steady traffic, and recovery as separate intervals. An overall average can hide a brief but important failure during a traffic transition.
Write a decision, not just a report
Summarize the workload, measurement window, pass criteria, actual outcomes, and likely constraint. For example: at the planned rate, successful throughput met demand, but p95 exceeded the agreed target while database connection wait increased.
Choose one follow-up change, repeat the same workload, and compare. For a release workflow, continue to the final article in this series.
Continue the series
1. How to Build an API Load Testing Plan
2. Load, Stress, Spike, and Soak Testing Explained
3. How to Read API Load Test Results
More from the blog
Read 3 related articles from our latest posts.