How to Load Test an API with 100 Concurrent Users
Configure a controlled 100-worker test, understand plan limits and pacing, and compare latency, throughput, and failures. Includes a k6 example.
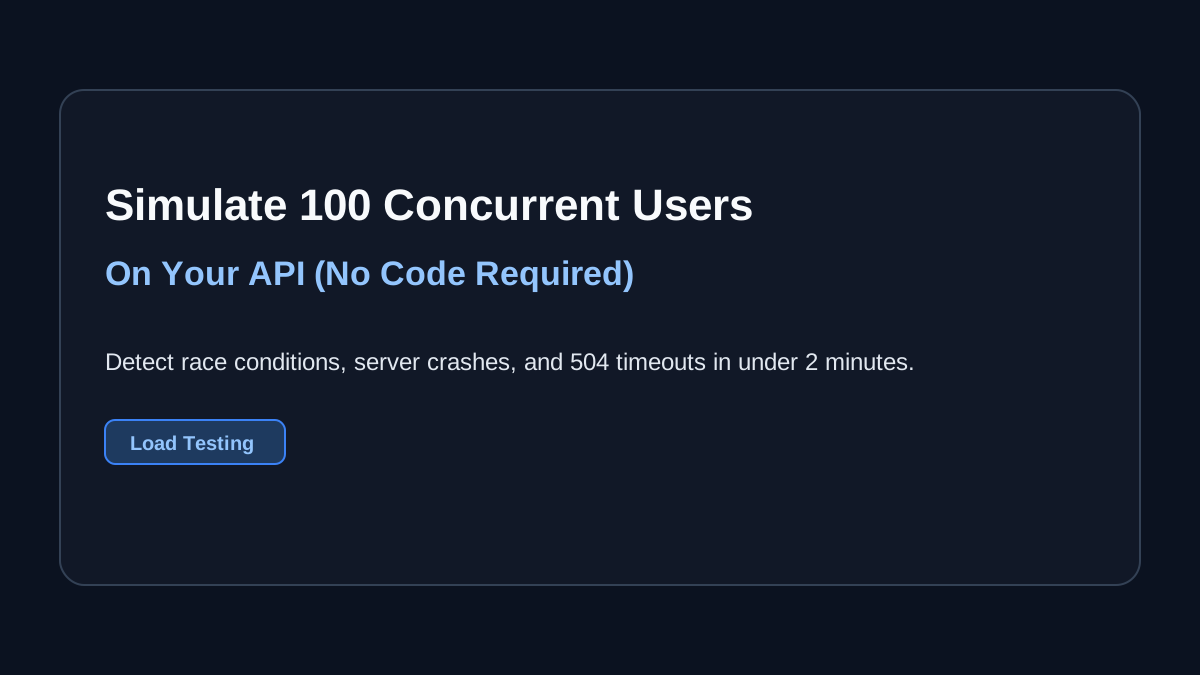
Configure 100 concurrent workers against an authorized endpoint, use a controlled duration and ramp-up, then compare throughput, failures, and latency. API Test Lab's Pro configuration allows up to 100 workers; the ongoing Free allowance is only 5 workers for 30 seconds. Trial access is separate. Check pricing.
Prerequisites
Use a reachable staging API you own or have permission to load test, representative data, a baseline, and server metrics. Agree on stop conditions with the service owner. Do not send load to public tutorial endpoints.
Workers model concurrent activity; they are not necessarily distinct authenticated people, and 100 workers does not mean 100 requests per second.
Configure the browser workflow
First send one request in the API tester and verify its response. Then open Load Tester, set the target URL and method, and configure the concurrency, duration, ramp time, and any required headers/body.
Example configuration for your own read-only staging endpoint:
{
  "url": "https://staging.example.com/health",
  "method": "GET",
  "concurrency": 100,
  "duration": 300,
  "ramp_time": 60
}
Replace the example URL. These are configuration values, not an executable API request. The frontend submits these fields to the runner. Confirm the achieved concurrency from the completed run; setting 100 alone does not prove that the runner sustained 100.
Start with a smaller baseline, then progress through 5, 25, 50, and 100 workers where authorized. Keep payload, deployment, region, and cache warm-up consistent. Stop if your agreed failure threshold is crossed.
Reproducible scripted alternative
If you need explicit pacing, this k6 example holds 100 virtual users for five minutes. Install k6 first and save as load.js. It is a separate workflow, not a claim that API Test Lab runs k6 internally.
import http from 'k6/http';
import { check, sleep } from 'k6';
export const options = {
  vus: 100,
  duration: '5m',
  thresholds: {
    http_req_failed: ['rate<0.01'],
    http_req_duration: ['p(95)<500'],
    checks: ['rate>0.99'],
  },
};
export default function () {
  if (!__ENV.TARGET_URL) throw new Error('Set TARGET_URL to your authorized endpoint');
  const response = http.get(__ENV.TARGET_URL);
  check(response, { 'status is 200': r => r.status === 200 });
  sleep(1);
}
Run only after replacing the URL with your authorized target:
k6 run -e TARGET_URL=https://staging.example.com/health load.jsThe thresholds are illustrative, not universal service targets. This script begins at 100 VUs; do smaller baseline runs first. The official k6 constant-VU documentation explains this workload model.
Expected results
Expect a report with completed request count, achieved rate, errors, and durations. There is no universal passing RPS. With sequential requests and one second of pacing, a worker completing each request in 0.2 seconds produces roughly 1 / 1.2 requests per second; 100 such workers would produce about 83 requests per second. This is illustrative arithmetic, not measured performance.
Verify body correctness too. A fast error page is not a successful API response. Review p50/p95/p99 alongside timeouts and failure counts.
Common errors and retesting
- Plan limit: reduce concurrency or choose a plan that supports 100; do not assume a trial's limits persist.
- 401/403: validate authentication in a single request and ensure credentials remain valid for the run.
- 429: inspect documented quotas; do not bypass the API's limits.
- Generator saturation: inspect runner capacity before attributing a throughput plateau to the API.
- No representative behavior: a health endpoint is only a smoke test, not a realistic user journey.
Use the bottleneck workflow to identify one cause, change it, and repeat the same run. Explore API Test Lab load testing and check plan allowances.
More from the blog
Read 3 related articles from our latest posts.